Stock charts are essential tools for investors, providing a visual representation of a stock’s performance over time. Learning to read these charts can help you make better-informed investment decisions. This guide will introduce you to the basics of stock chart analysis.
Introduction
Stock charts can seem complex at first glance, but they’re fundamental to understanding market trends and stock behavior. By deciphering chart patterns and indicators, investors can predict future price movements more accurately.
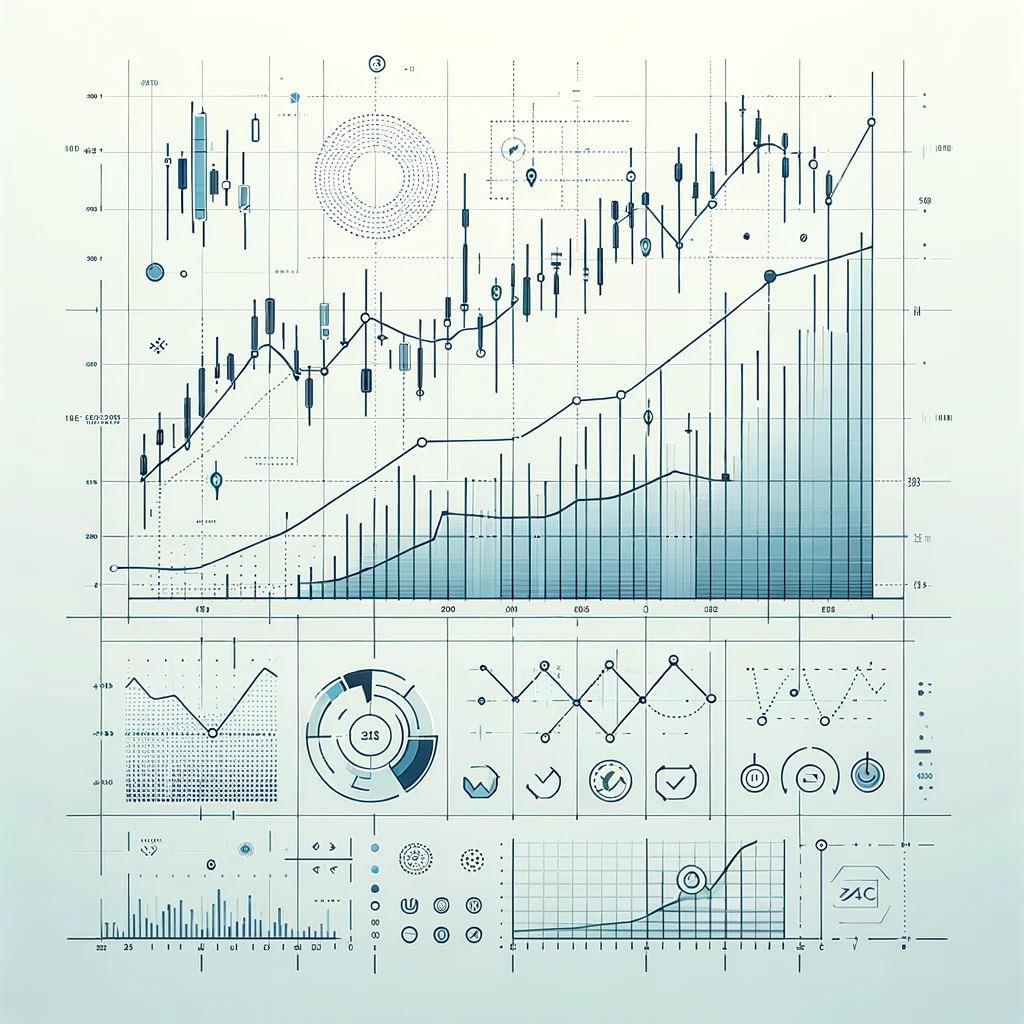
Understanding Stock Chart Types
Line Charts
- Description: Line charts track the closing prices of a stock over a specified period.
- Use: Ideal for a quick glance at a stock’s historical performance.
Bar Charts
- Description: Each bar represents trading data for one day or another time frame and shows the opening, closing, high, and low prices.
- Use: Offers more detail than a line chart, useful for identifying trends.
Candlestick Charts
- Description: Similar to bar charts but uses “candles” to show price movements. The body’s color indicates whether the closing price was higher or lower than the opening price.
- Use: Provides insights into market sentiment and potential price reversals.
Key Components of Stock Charts
- Volume: Shows the number of shares traded during a specific period, usually displayed at the bottom of the chart.
- Trend Lines: Drawn to connect highs or lows, helping to illustrate a stock’s upward or downward trend.
- Moving Averages: A line that smooths out price data over a specific period, making it easier to spot trends.
Reading Chart Patterns
Understanding common chart patterns is crucial for predicting future movements:
Head and Shoulders
Indicates a reversal in trend, where a peak (head) is preceded and followed by smaller peaks (shoulders).
Double Top and Bottom
These patterns signal changes in momentum. A double top suggests a downward trend, while a double bottom indicates an upward trend.
Bull and Bear Flags
These continuation patterns show brief pauses in a trend before it resumes in the direction of the prevailing trend.
Frequently Asked Questions (FAQs)
How long does it take to learn to read stock charts effectively?
The time it takes to become proficient in reading stock charts varies by individual. With regular practice and study, most beginners can grasp the basics in a few weeks, but mastering the nuances can take months or even years of experience.
Do I need special software to read stock charts?
While there are many advanced software packages and online platforms available for technical analysis, many free resources provide basic stock charting capabilities. Start with these as you learn the fundamentals before considering paid options.
Can stock charts predict stock prices?
No tool can predict stock prices with 100% accuracy. However, reading stock charts can help investors make educated guesses about future price movements based on historical patterns and trends.
What is the most important thing to look for in a stock chart?
While different analysts may prioritize different indicators, many agree that volume and price are the most critical elements. The relationship between these two can provide valuable insights into a stock’s potential future movement.
Are candlestick charts better than bar charts?
Candlestick charts offer more visual detail than bar charts, making it easier to understand market sentiment and potential reversals at a glance. However, the “best” chart type depends on your personal preferences and investment strategy.
How often should I check stock charts?
The frequency should match your trading or investment strategy. Day traders may need to monitor charts in real-time, whereas long-term investors might only review charts weekly or monthly.
Can reading stock charts help me choose stocks?
Yes, technical analysis of stock charts is a valuable skill for selecting stocks, especially when combined with fundamental analysis. Charts can help identify buying or selling opportunities based on historical performance and trends.
Conclusion
Reading stock charts is an invaluable skill for investors, providing insights that are not apparent from financial statements alone. As you become more familiar with charts and patterns, you’ll gain a deeper understanding of market dynamics and improve your investment strategy.
Check our blog for more insights!